Obesity among adults and children has reached epidemic proportions in the last 10 years, especially among low-income, minority populations. As American diets turn to foods that are fast and convenient over fresh and healthy, the mortality rate of once preventable diseases continues to skyrocket. Before blaming the consumers themselves, however, one must ask whether or not every consumer in America has equal access to the fresh, healthy foods that help prevent disease and keep us living longer. This study investigates the question: When looking at the greater Los Angeles region, do people in lower income communities have less access to large supermarkets when compared to the supermarket access of people in higher income communities? The study sites investigated in this project include Santa Monica and South Los Angeles. Accessibility was analyzed based on median-household income, race, and the community characteristics of greenness and temperature. In order to research and compare these factors, I used the remote sensing program ENVI in order to analyze greenness and temperature, and used the GIS programs of MapInfo and GoogleEarth in order to map the spreads of race and income and identify supermarket locations within my study regions. The results of the study indicated that neighborhoods with higher incomes and lower concentrations of minorities throughout both of the study areas had increased access to supermarkets when compared to the lower-income, high minority communities. It was also discovered that supermarkets were more likely to locate themselves in neighborhoods of higher greenness levels and decreased temperatures. Most interesting to find, however, was how de facto urban segregation is still ruling the lay out of most of the city of Los Angeles and is especially seen in the smaller, liberal city of Santa Monica.
Introduction
Many external social, economic and environmental factors can influence an individual’s daily dietary choices. Past research as proven many of these key external factors include personal or family income (Hendrickson et al., 2006), cost of food (Morland et al., 2009), accessibility to transportation (Morland et al., 2009; Pothukuchi and Kaufman, 1999), and, most importantly, overall community food environment (Powell et al, 2006; Morland et al., 2009). When examining the above influences on the diets of urban, low-income populations, inequalities in the American food system begin to surface.
Previous research studies have investigated community food accessibility and its relations to food store and restaurant locations. For example, larger chain supermarkets are more likely to stock larger amounts of healthier foods and fresh produce at lower prices (Powell et al., 2006; Larson et al., 2009). Small, non-chain grocery stores and convenience markets, on the other hand, are more likely to stock an abundance of inexpensive prepared, high calorie foods and offer small quantities of fresh produce at high prices (Larson et al., 2009). Larson et al’s (2009) study ultimately proved that individuals with better access to large chain supermarkets over smaller non-chain grocery stores and convenience markets were more likely to have a healthier diet. This conclusion was drawn because not only were healthier options less expensive at supermarkets, but healthier options were also found in more abundance at the larger markets, thus more likely to be purchased by customers (Larson et al., 2009). Despite these facts, however, not all sectors of the American population have equal access to affordable supermarkets and healthy food. Urban communities of lower socioeconomic status, for example, actually have decreased access to large supermarkets when compared to suburban middle to high-income non-minority communities (Powell et al., 2006). Without a large supermarket near by, low-income, minority residents are forced to shop at the smaller non-chain grocery stores, convenience markets and fast food restaurants where foods are high in calories and price, but low in quality (Hendrickson et al., 2006). In fact, according to Morland et al. (2009), low-income minority residents are more likely to pay 3-37% more for the same groceries than a resident shopping in a suburban non-minority community with supermarket access.
Due to high prices and decreased accessibility for fresh fruits and vegetables, previous research has also shown that individuals with limited incomes are less likely to have the ability to purchase the right types of food to ensure a healthy diet (Hendrickson et al., 2006; Morland et al. 2009; Pothukuchi and Kaufman, 1999). When inaccessibility to healthy foods becomes widespread, communities become “food deserts” or “areas of relative exclusion where people experience physical and economic barriers to accessing healthy food” (Reisig and Hobbiss, 2000; 140). Food deserts occur disproportionately in low-income minority communities causing individuals, especially children and adolescents, living in these communities to have increased early mortality and morbidity rates when compared to the general population (Hendrickson et al., 2006; Yancey et al., 2004).
This research study investigates the relationship between income, race and overall neighborhood characteristics (NDVI (greenness) and temperature) in relation to supermarket placement across the city of Los Angeles. Through comparing and contrasting the above factors with supermarket locations within these two communities I hope to discover if when looking at the greater Los Angeles region, do people in lower income communities have less access to large supermarkets when compared to the supermarket access of people in higher income communities?
Methods
Study Sites:
Santa Monica:

Santa Monica is a coastal community located on the periphery of West Los Angeles. According the the 2009 US Census, the city of Santa Monica is home to approximately 87,563 people and is roughly 3 miles wide and 2.5 miles long (US Census, 2009). In terms of regional population, West Los Angeles has about 651,000 residents.
South Los Angeles:

South Los Angeles is comprised of a series of communities located between the 405 Freeway and the 710 Freeway South of Downtown Los Angeles and is approximately 16 miles wide and 5 miles long. For this project, I chose to focus on only a small section of South Los Angeles (approximately 16 miles wide and 2 miles long) in order to better compare the region to the smaller city of Santa Monica.
South Los Angeles is home to roughly 1.32 million people (Park et al, 2008). According to a study performed by the Community Health Councils (2008), South Los Angeles is made up of many distinct commmunities including West Adams, Hyde Park, Compton, Watts and Baldwin Hills. Also known as South Central Los Angeles, the area was "once described as more a condition than a place" as almost all of its inclusive communities were and in many instances still are plauged with poverty, increased instances of preventable diseases, and increased mortality rates (Park et al, 2008; 14). To many scholars South Los Angeles is described as an outgrowth of racial segregation and "is in large part a reflection of the historical patterns of desegregation and migration of LA County's African American population against a backdrop of the urban decline in a changing global economy" (Park et al, 2008; 14).
City of Los Angeles: Race Overview (Latino Population)
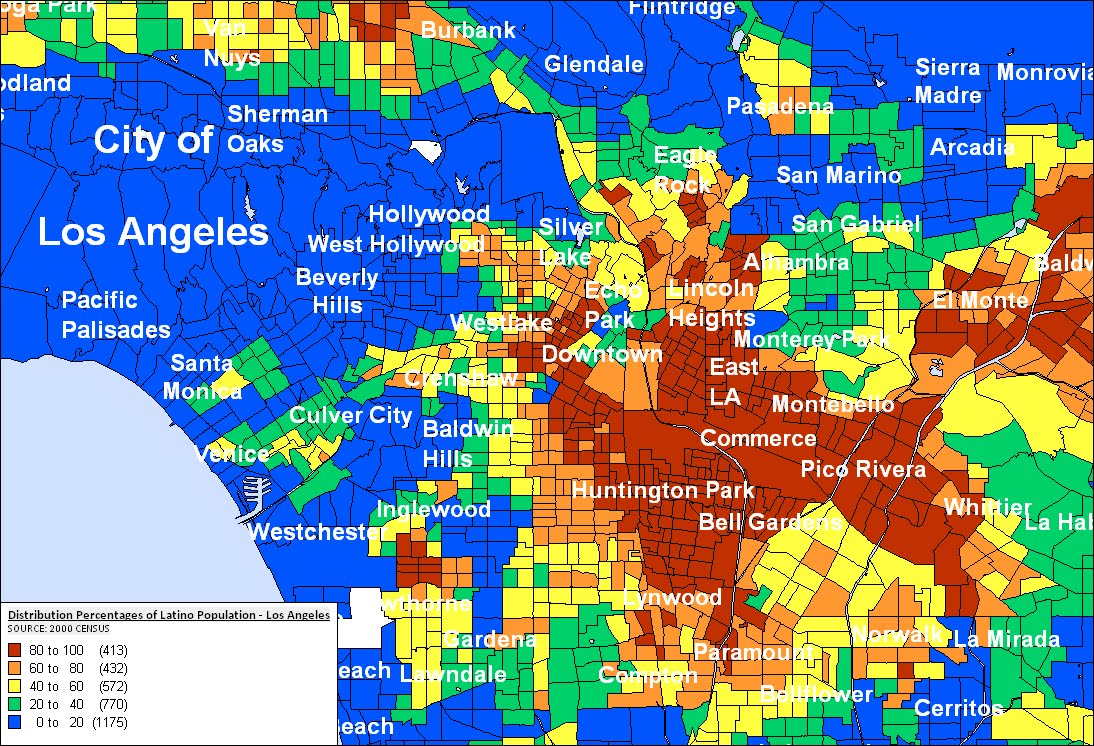
When compared to West Los Angeles, South LA had approximately double the residents of West Los Angeles despite being smaller in geographic size (Park et al, 2008). Once a community of mostly white affluence, South Los Angeles is now a region of mixed racial and ethnic backgrounds and is currently home to the largest segment of Black (31%) and Latino (62.4%) residents in all of Los Angeles County (Park et al, 2008). In contrast, West Los Angeles, the Los Angeles region home to the city of Santa Monica, has a very large White population (61.3%) with minimal minority populations (16.6% Latino, 7% Black) (Park et al, 2008). The regional characteristics of West Los Angeles are exemplified when examining the single city of Santa Monica, where over half of the population is White, while only a small portion of the city has a high Latino/minority population.
I chose to focus on only the Latino population within Los Angeles because the Latino minority is one of the largest minority groups across Southern California.
City of Los Angeles: Personal Income Overview

According to the Park et al (2008) study, the average median household income for residents in South Los Angeles (approximately $27,303) was less than half of the average income for residents living in West Los Angeles (approximately $60,464). Looking at the above maps, one can also see that while South Los Angeles has a number of communities with pockets of residents living below the poverty line, while almost all residents living in West Los Angeles live above the poverty line. The Park et al(2008) study also states that residents living in South Los Angeles are twice as likely to be unemployed and not own a home when compared to residents of West Los Angeles.
Data:
The images used to analyze NDVI or neighborhood greenness were acquired from the Maryland Global Land Cover Facility. Using the Earth Science Data Interface, I downloaded ETM+ images from Landsat 7. According to NASA, Landsat 7 has a swath width of 185 km, a repeat time of 16 days, a panchromatic band with 15m spatial resolution, on board, full aperture, 5% absolute radiometric calibration and a thermal IR channel with 60m spatial resolution (Source: http://geo.arc.nasa.gov/sge/landsat/l7.html). For NDVI analysis, I downloaded Landsat 7 images that included band 3 (red) with a spectral resolution of .63-.690 microns and a ground resolution of 30m as well as band 4 (Infrared) with a spectral resolution of .75-.90 microns and a ground resolution of 30m. In order to analyze the thermal conditions of each community, I downloaded the Landsat 7 image that included band 6 (thermal) with 10.4-12.5 microns and a ground resolution of 60m. All of the downloaded images were produced by the USGS.
The edited Landsat 7 images exemplifying NDVI and temperature across each community were created using the ENVI Remote Sensing Program. For NDVI, I first opened my images (Bands 3 and 4) in ENVI (choosing RGB and setting the bands to upload as R: band 4 G: band 3 B: band 4 before opening image in display)then subset the image until it included only my study areas, either Santa Monica or the smaller section of South Los Angeles. I then went to the power bar, chose transform, then clicked on NDVI. After choosing my subset image, I chose Landsat TM and changed the red band value to 2 and the NIR band value to 1. After renaming the file before saving, I then opened the image in a new display. The image displayed should be black and white, with the highest amount of greenness being represented by the color white, and the lowest amount of greenness being represented by the color black. Using the spatial pixel editor, I recorded the value of greenness or lack of greenness within my study area. The values of greenness run from -1 (lacking greenness) to 1 (completely green).
For my images displaying the thermal conditions of both Santa Monica and South Los Angeles, I uploaded the thermal Landsat 7 image (Band 6) to ENVI. After opening the image in a display window, I then subset the image to include only my study areas, either Santa Monica or South Los Angeles. On the images power bar I then went to overlay and performed a density slice. After choosing my subset image and applying the density slice I opened my image in a new display and linked the display with the original black and white thermal image. I used this link in order to discover where the hottest areas of each region were located (identified as the black color in the black and white image) and where the coldest regions of each region were (identified as the whiter colors in the black and white image) in the density sliced display. After identifying the association between the hot and cold regions in the black and white and density sliced images, I then edited the provided color ranges in the density slice to show the hottest areas as red, and the coldest areas as dark blue with a mix of yellows and oranges displaying the hot, mild-hot, and warm areas as well as a mix of light blue and semi-darker blues displaying the cold, mild-cold and cool areas located in between both the red and dark blue extremes. I then saved the images as .bmp's in order to upload them to the blog site.
For the images that analyze the study areas, supermarket locations and individual supermarkets I downloaded data from Google Earth. The images provided by Google Earth are also taken by Landsat 7. Google Earth's Images simulate true color 15-meter global imagery products built from the NASA Landsat 7 imagery with the TruEarth program. Most of the surface area images available via Google Earth are based on enhanced and color balanced Landsat 7 imagery. In order to find my images, I simply searched the name of each study site and drew in the polygons using the polygon tool provided by Google Earth. To find the grocery store location sites, I clicked on the "Grocery Store" tab under "Place Categories" found in the "Layers" tab. Once I identified the larger chain supermarkets in the area by dragging my mouse over the shopping cart icons, I then zoomed in a each one in order to acquire an image of the parking lot. For every Google Earth image seen below, I simply saved each image I needed on the screen as a .bmp to upload on the blog.
The stars in both the NDVI and thermal maps were placed using Paint and represent the location of grocery stores within a region.
The maps displaying spread of race and median household income across the city of Los Angeles were designed using the GIS program MapInfo. The maps were created using 2000 US Census data provided by UCLA Sociology Professor David Halle. After opening up either the income or race layers over the provided map layer of Los Angeles County, I then changed the increments for either income bracket or race percentage provided in the legend. For income bracket, I chose to start my increments from $0-$17,050, as $17,050 was the income level that defined whether or not a person was located below or above the poverty level for the year 2000. Starting at $0, I was then able to discover communities around the city of Los Angeles that housed residents who were below the 2000 Federal Poverty Level. After the "below poverty line" income bracket of $0-$17,050, I then chose to allot each increment in the legend a different income level (Lower-middle class:$17,050-$30,000; Middle-class: $30,000-$50,000; Upper-middle class:$50,000-$90,000; Upper-class: $90,000-$201,000) in order to analyze diversity in income levels across the county. For race, I chose to divide the legend up based on 20% increments (0-100%) in order to have 5 categories and keep the map comparable to the 5 categories found in the median household income map.
Analysis
This study analyzes whether or not there are connections between the neighborhood characteristics of overall community greenness (NDVI), neighborhood temperature, spread of Latino population, and median-household income in relation to supermarket location in two different communities within Los Angeles County. The results of the studies in both South Los Angeles and Santa Monica were then compared to each other for a larger-scale analysis.
Results
Supermarket Locations
Each grocery cart above represents an establishment in which food can be bought. The labeled grocery carts represent larger chain supermarkets, while the unmarked carts represent places such as local corner stores, small specialty markets, gas stations and convenience stores.
Santa Monica:

Looking at the map above, it is apparent that the major grocery store chains located in the city of Santa Monica are Ralph's, Albertsons, Whole Foods, Trader Joe's, Vons and Pavillions. Despite not being a chain supermarket, I chose to include the Santa Monica Co-Op in the map as well because it is a popular grocery store for many Santa Monica residents and sells a range of products from produce to meat and cleaning products to beauty products. Due to its size and variation in products, the Santa Monica Co-Op is a direct competitor with Whole Foods in the Santa Monica area.
When looking at the spread of grocery stores throughout the city of Santa Monica, it is very interesting to see that most of the large chain supermarkets, especially the upscale chains such as Whole Foods and Pavillions are located on the periphery of the city, while almost no major chain supermarkets apart from Ralph's are located near the city's center.
Supermarket Location and Income
When comparing supermarket locations to race and income in Santa Monica, it becomes apparent that upper-scale grocery stores, such as Whole Foods and Pavillions, are located on the periphery of the city, correlating almost directly with the neighborhoods of the wealthiest residents in Santa Monica as displayed in the median-household income map provided above. Locating themselves in these areas allows upper-scale supermarket chains to create ease of access and properly serve the wealthiest residents of city, but most likely decreases accessibility for Santa Monica residents living towards the city's center where incomes are lower to the upper-scale establishments. Upper-scale supermarkets throughout Santa Monica are also located near neighborhoods comprised of mostly single-family homes and minimal apartment buildings.
Looking at the locations of the other supermarkets throughout Santa Monica, it is apparent that most supermarkets in the city are located on major streets and near mostly middle and upper-middle median household income residents. Unlike the upper-scale supermarkets on the far north and south sides of Santa Monica locating only near single-family homes, the supermarkets sprinkled throughout the rest of Santa Monica are located mostly near a mix of single-family homes and apartment buildings.
All of the supermarkets within the city of Santa Monica, whether located on the periphery or closer to the center, also have parking lots. With multiple Big Blue Bus routes and countless bus stops located throughout the city, however, I believe it is safe to assume that due to the location of most supermarkets on major city roads almost all residents in the city of Santa Monica can access the supermarket of their choice via public transportation despite income.
Supermarket Location v. Spread of Latino Population
As seen when comparing the location of supermarket chains in relation to income-levels across Santa Monica, I also found interesting results when analyzing supermarket chain to the spread of the Latino population across Santa Monica.
Similar to the correlations between upper-scale supermarket locations and location of wealthy neighborhoods, when compared to the spread of the Latino population, upper-scale supermarkets (Whole Foods and Pavillions) are also only located in areas of Santa Monica that correlate with minimal to no minority residents when compared with the Los Angeles County Race (Latino) population map provided in the Methods section. I believe this correlation mostly exists due to the upper-scale supermarkets locations on the periphery of the city, for like the city of Los Angeles on a larger-scale, the small city of Santa Monica also has a high population of non-Latinos or Whites on the periphery of the city (where the upper-scale supermarkets are located) and its highest percentages of Latinos near the city's center (where the upper-scale supermarkets and almost no other supermarkets are located).
The exception to this trend appears to be Trader Joe's, which is a supermarket that competes with Whole Foods by offering specialty organic foods at inexpensive prices. When looking at the spread of Latino population map in relation to the Santa Monica supermarket location map, it is apparent that despite its specialty store status and periphery location, Trader Joe's is actually located within a section of Santa Monica that is roughly 20-40% Latino. When looking closer at the map, however, one may be lead to believe that this is only the case because Trader Joe's is located directly next to both a freeway overpass and a freeway exit, and as previous scholars have shown, minority neighborhoods are more likely to be clustered near the city's freeways (Halle, 2003).
Further comparing supermarket location and spread of the Latino population within the city of Santa Monica, it becomes apparent that many supermarkets are located around the city's lower-income, high minority center, but none of the major chain supermarkets are actually located inside the city's center. Due to these periphery locations, those living within the city's center, most residents who are disproportionately poor and of minority status, lack easy accessibility to larger chain grocery stores and instead are forced to shop at corner stores, convenience marts and possibly pay higher prices or travel a great distance in order to receive the same food as Santa Monica's wealthier, non-Latino residents living on the city's periphery.
South Los Angeles:

After studying the supermarket locations across the city of Santa Monica in West Los Angeles, one of the most striking differences when looking at the map of supermarket locations in South Los Angeles is the names of the supermarket chains. With the exception of Ralph's, none of the other grocery store chains (Whole Foods, Trader Joe's, Albertsons, Vons, Pavillions) are located in South Los Angeles. Having visited a handful of the supermarkets highlighted in the South Los Angeles study area, it can be concluded that many of the chains located in this region are ethnically targeted toward the large Latino population in name (Superior Warehouse Grocer), are large in scale and focus on selling cheap foods in bulk (Costco, Smart and Final, Sam's) and lastly appear to emphasize inexpensive prices (Food 4 Less). In Santa Monica, on the other hand, the grocery store names tended to emphasize nutrition (Whole Foods), feelings of ornateness or grandeur (Pavillions), or a sense of community by simply having a single person's name (Albertson's, Ralph's, Trader Joe's) almost as if to make the large chain grocery store feel like a small-scale, community market.
Supermarket Location v. Median-Household Income
Similar to the relations between median-household income and supermarket location in Santa Monica, supermarkets in South Los Angeles also appear to have selected their locations based on surrounding neighborhood demographics. For example, both Sam's Club and Costco, larger chain warehouse superstores, are located in periphery neighborhoods of South Los Angeles that are of slightly higher incomes (approximately $30,000-$50,000). This may be because Costco attracts a wide range of clientele from a variety of demographics and the companies may fear by locating themselves directly in a low-income area the stores may lose some of their wealthier customers due to the reputation the lower-income community may have from the perspective of a wealthy outsider.
On the opposite end of the economic spectrum, supermarkets such as both Food 4 Less locations and all of the Smart and Finals in the highlighted study area are located near or within lower-income ($17,050-$30,000) neighborhoods. Interestingly enough, the names of these supermarkets both appear to emphasize the inexpensiveness of their food by either stating customers can by purchase all food for less at a certain chain or that customers are smart by shopping for food at final or close-out prices.
As mentioned before, Superior Warehouse Grocers is an Latino targeted supermarket chain specializing in traditional Mexican produce, the most popular Mexican brand name products and ensures to print all of the aisle signs and coupon flyers in both Spanish and English. When looking at the map above, it is interesting to note that Superior's periphery location is not important because it is a specialty store that appear to cater to the wealthier communities of South Los Angeles, but instead is a specialty store that caters to the lower-income Latino communities of South Los Angeles, thus is an exception to the theory of periphery city growth. Instead of increases ease of access to wealthier residents, Superior's periphery location in South Los Angeles allows the store to also be accessible to the large Latino population of East Los Angeles, therefore allowing the store to serve multiple lower-income communities at once.
Lastly, what I found most interesting in this study was that after discovering that most residents of South Los Angeles did not own a home (Park et al, 2008) I completed a survey of the area using Google Earth. After scanning the neighborhoods located around the supermarkets studied in South Los Angeles, I was astonished to see that almost all of the surrounding streets closest to the markets were made up of single-family homes, most of which, according to Zillow.com, were worth more than $150,000. This means that those people in South Los Angeles with the most money and could afford a mortgage payment or higher rent fees had the most accessibility to grocery stores, while a majority of South Los Angeles residents who did not live in single family homes had decreased access to the supermarkets due to increased walking distance or increased time needed to shop due to having to take public transportation.
Supermarket Location v. Spread of Latino Population
In terms of supermarket location and spread of the Latino population across South Los Angeles, it is apparent when comparing the two maps that without a doubt almost all supermarkets within the region are located in highly concentrated minority communities (40-100%). This pattern most likely occurs more in South Los Angeles than in Santa Monica due to the extensive Latino population that resides in South Los Angeles neighborhoods.
The main exception to this pattern is Costco, who, similar to other periphery supermarkets in Santa Monica, is located in a wealthier, mostly non-Latino community. Again, as mentioned before, this may be due to the wide range of shoppers Costco attracts.
NDVI/Greenness
Santa Monica:

Looking at the map above, it is apparent that Santa Monica is a blend between areas of greenness and non-greenness. Knowing that the pixel value of 1 indicated complete greenness, it was not a surprise to see that the Penmar golf course located on Santa Monica's south border had the city's highest pixel value of approximately .70. Many of the parks located throughout the city range in pixel value form .50-.70. All of the residential streets throughout the city of Santa Monica are a light grey (.30-.50) due to the city's lush, tree-lined residential streets. The darkest or most non-green places (ranging in pixel value from -.10 to -.15) are all located near the 10 Freeway and towards the center of the city.
NDVI v. Median-Household Income
All of Santa Monica's lower-income areas ($17,050-$30,000) are located near the center of the city where the city's least green areas are found. On the other hand, some of the city's greenest areas are located on the periphery and are associated with the residents of the highest incomes ($50,000-$201,000).
Taking a more in-depth look at Santa Monica's residential areas, residents making approximately $30,000-$50,000 greatly correlate with the areas of light grey on the NDVI maps. The whiter colors on the NDVI maps or the peaks of greenness throughout the city of Santa Monica are greatly associated with the homes of those residents making $50,000-$201,000 a year.
When looking at income is it also interesting to note that no area of Santa Monica has an NDVI pixel rating of 0 or complete non-greenness. When relating this factor to income, I believe that Santa Monica may have no areas within its borders that completely lack greenness due to the fact that no where within the city do people live below the poverty level, thus a majority of residents can afford to pay their city taxes to keep the city of Santa Monica green with parks and tree-lined streets.
NDVI v. Spread of Latino Population
When comparing the maps of overall city greenness and overall spread of Santa Monica's Latino population, it is easy to see that the greenest spaces in Santa Monica have no more than 20% Latino populations. It also becomes apparent when comparing the two maps that the darkest areas on the NDVI map or the less green spaces in the city are almost directly located in the city's center where the highest concentration Latinos live within the Santa Monica city limits.
NDVI v. Supermarket Location
Looking at the maps of overall community greenness and supermarket locations for Santa Monica, one can see that the city's largest chain markets are located in the city's greener areas. This may be in part due to the fact that many of the city's supermarkets are located near residential areas, thus are located near tree-lined streets as discussed above, ultimately increasing the greenness values of the markets surrounding areas. As mentioned before in previous sections, no stores are located within Santa Monica's city center where incomes are lowest and concentrations of Latino residents are the highest, therefore no grocery stores are located near the darkest or least green parts of the city. The exception to this pattern, however, is Trader Joe's which is located within a close proximity to a freeway overpass and entrance.
South LA:


Looking at the 3D NDVI model provided for South Los Angeles, one can see where the city of Santa Monica had a nice blend of green and less-green areas, there are drastic differences between the amount of greenness in South Los Angeles West of the 110 freeway when compared to the amount of greenness East of the 110 Freeway. These drastic differences are in fact due to the neighborhoods West of the 110 having a wider spread of large parks. West of the 110, some of the greenest areas ranged in pixel value from .50-.70, the same value range for many of the parks located throughout the city of Santa Monica. Some of the darkest areas West of the 110 Freeway ranged in pixel value from -.02 to -.01. Like their Santa Monica counterpart, these mostly non-green areas were located near the freeway and more toward the center point of the study area.
Where areas West of the 110 are mostly green and lush with parks, areas East of the 110 in South Los Angeles are mostly lacking any form of greenness with some of the darkest areas holding pixel values of -.09, -.17, and -.20. Almost all of these dark or non-green areas are located along the freeway. Most of the greenest areas (pixel values .30-.50) East of the 110 are located on the periphery, near the 710 Freeway. These locations are where the largest parks in the area are located, however, when compared to the park size of neighborhoods West of the 110, parks East of the 110 are much smaller in size.
NDVI v. Median-Household Income
In South Los Angeles there is an intense correlation between community greenness and income. For example, the lighter or greener pockets West of the 110 freeway that are located on the periphery (towards the 405 Freeway) are associated with median-household incomes ranging from $30,000-$90,000, or the with the areas most wealthy residents. Many of the darker patches or less green areas located throughout the study area West of the 110 freeway are associated with lower income brackets, or those residents who are making between $17,050 and $30,000 a year.
Although the areas East of the 110 in South Los Angeles are mostly non-green, there are a few neighborhoods in the area that are actually lighter in color or greener when looking at the map above. Near the top of the 110 freeway, one can clearly see a lighter or green spot East of the 110 freeway. Unlike the surrounding darker areas, this spot is associated with residents who make between $50,000-$90,000 a year and is relatively close to the USC campus. The darker or less green areas East of the 110 freeway are associated with the low-income pockets near the downtown Los Angeles area ($0-$30,000) that even include South Los Angeles residents living below the poverty line.
Even though one of the largest income brackets in the South Los Angeles area is approximately $30,000-$50,000 as it was in Santa Monica, I believe the areas East of the 110 freeway in South Los Angeles when compared to the city of South Los Angeles must have more residents on the lower part of the $30,000-$50,000 income bracket, while Santa Monica must have people on the higher end. Also, I believe due to Santa Monica's size, amount of wealthy residents, and overall periphery location, the city is able to have a better functioning and more successful city government that meets the needs of its residents, while in South Los Angeles, due to its size, lack of income and central or core location, may have a harder time organizing community members to facilitate successful city policies including policies that increase overall community greenness.
NDVI v. Spread of Latino Population
East of the 110 freeway, some of the darkest or least green areas of South Los Angeles are associated with high Latino concentrations (40-100%). West of the 110 freeway, however, not only are the green areas more widespread, but the Latino population is also more widely spread throughout the city. Despite this fact, however, those areas with the higher incomes and the smaller Latino populations (0-40%) West of the 110 freeway are greener than those areas West of the 110 Freeway with lower income residents and high Latino populations.
NDVI v. Supermarket Location
What I find most interesting when comparing supermarket location to overall community greenness in South Los Angeles is that Superior Warehouse Grocer, the ethnically targeted grocery store discussed earlier, is actually located in one of the least green parts of South Los Angeles. The two Smart and Finals located in the study area also are located closer to the less green areas, thus the areas with lower incomes and higher Latino populations.
Sam's Club, a periphery warehouse store that is a direct competitor with Costco, is located in one of the greenest areas East of the 110 freeway in South Los Angeles. Similar to Costco, I believe Sam's Club has chosen this periphery location in a greener area in order to appeal to all of their wide ranging clientele. Costco, located West of the 110 Freeway on the periphery, is in a slightly less green area when compared to Sam's Club's location in South Los Angeles.
Even though East of the 110 freeway in South Los Angeles one is more likely to find an increased number of non-green areas, this region actually still has a larger amount of chain grocery stores when compared to areas in South Los Angeles West of the 110 freeway. This may be due to the fact that due to higher incomes, those living West of the 110 freeway and towards the western periphery in South Los Angeles may have increased mobility and actually leave the area in order to grocery shop, instead fleeing to the near by towns of Culver City, Palms and Mar Vista in order to avoid traveling near the city's center.
THERMAL
COLOR KEY FOR ALL THERMAL MAPS:
Darkest Blue (Blue 3) = Coldest
Blue = Cold
Cyan = Mild Cold
Yellow = Mild Warm
Dark Orange (Orange 3) = Warmer Mild Warm (Seen in South Los Angeles Map Only)
Orange = Hot
Red = Hottest
SANTA MONICA:

The warmest areas in Santa Monica appear to be along the 10 freeway. This is must likely due to the increased amounts car exhaust and other air pollutants readily found in the air near freeways. This particulate matter traps outgoing longwave radiation in the air, thus increases the surface heat of surrounding areas. These areas along the freeway in Santa Monica are also associated with decreased greenness, thus have less shade and are more likely to heat up during the day.
Looking at the map, one can also see a bright red strip running along the coast. This strip represents the Pacific Coast Highway. As described above, due to the high traffic usage generating large amounts of air pollutants and particulate matter, it is no wonder this area is hotter than most in the city. The area near the Pacific Coast Highway may also be warmer due to its location directly next to the Santa Monica Bluffs. The Bluffs may trap the particulate matter and air pollutants, thus the heat, down near the highway.
Santa Monica's coldest regions are located closer to the center of the city, but still near the periphery. All of these locations are mostly located away from the freeways. The warmest parts of Santa Monica are located in the city's center, the same areas that are associated with less greenness, lowest income and highest Latino concentration as seen in earlier maps. As mentioned before, this area of the city appear to lack an abundance of trees, thus due to less shade and decreased natural removal of greenhouse gases by the trees (CO2) it is no wonder the city's center is one of Santa Monica's warmest regions. Overall, however, Santa Monica does have more cold areas than warm ones.
Thermal v. Median-Household Income
Overall, Santa Monica is mostly a cool place in terms of temperature and is also overall mostly comprised of residents residing in middle to upper class income brackets. When analyzing the relations between temperature and income throughout the city of Santa Monica, it is apparent that the higher the income ($50,000-$90,000) directly correlated with some of the coldest areas of the city. The lower-income pockets found near the ocean ($17,050-$30,000) were associated with higher temperatures, as were the lower-income communities located towards the city's center.
Thermal v. Spread of Latino Population
After analyzing the above factors, it is obvious that temperature and spread of Santa Monica's Latino population highly correlate. Increased neighborhood temperatures in Santa Monica are associated with neighborhoods of increased Latino populations (40-60%), while areas that have cooler temperatures are associated with neighborhoods of mostly non-Latino populations (0-20%).
Thermal v. Supermarket Location
The specialty supermarkets such as Whole Foods and Pavillions are located in some of the coldest areas of the city. Ralph's and Trader Joe's, however, are located near the warmer areas of the city or are located near the 10 Freeway. I find it interesting that Ralph's is one of the only major chain supermarkets located near Santa Monica's city center, but is also the only supermarket in Santa Monica that also has a chain in South Los Angeles. Most of the other major chain supermarkets throughout Santa Monica are located in cooler, near-periphery locations.
SOUTH LA:


The coldest regions of South Los Angeles are almost directly associated with park location and size, thus are highly concentrated near the greener areas of the city. When comparing the areas both West and East of the 110 freeway, it is apparent that more cooler temperatures are found West of the 110. This may be in part due to the fact that those living West of the 110 freeway in the study region have somewhat higher incomes, larger park sizes, and less of a highly concentrated Latino population when compared with the East side of the 110 freeway. Unlike Santa Monica, however, due to the regions low-income characteristics and location toward the Los Angeles city center, South Los Angeles overall has more warm or hot areas than cold ones.
Thermal v. Median-Household Income
Neighborhoods of South Los Angeles that are located near parks, thus associated with higher incomes, are mostly cool in temperature. Since a majority of the South Los Angeles population is just above the poverty line, however, it is no surprise to see that the study region is mostly mildly warm. The darkest blue areas indicating South Los Angeles cooler regions are greatly associated with park locations, ultimately associating these cooler areas with neighborhoods higher incomes.
Some of the warmest areas in South Los Angeles appear next to the areas three freeways, where residents from some of the lowest income classes reside.
Thermal v. Spread of Latino Population
South Los Angeles' coolest areas are associated with mixed, mostly non-Latino communities, especially in the region West of the 110 freeway. Similar to the correlations found in the city of Santa Monica, neighborhoods with highly concentrated Latino populations (40-100%) are also associated with the areas highest temperatures.
Thermal v. Supermarket Location
Costco and Sam's Club in South Los Angeles are near some of the study region's coldest spots. Similar to Santa Monica, most of the major chain grocery stores in South Los Angeles appear to be located near cooler areas. This may be in part due to the fact that as mentioned before many of the supermarkets in South Los Angeles are located near communities of single family homes. Single family homes most likely have lawns, thus have increased greenness, therefore are usually correlated with decreased temperatures.
Discussion
After looking at all of the results presented in the study, it is apparent that de facto segregation is still widely found throughout the city of Los Angeles when analyzing the community characteristics of income, race, greenness, temperature and supermarket location. The spread of Los Angeles based on these factors appears to still be in line with urban sociologist Ernest Burgess's theory of concentric ring development. Burgess's theory states that the city will develop over time to have the wealthiest commuters living on the periphery, furthest from the city's center, while over time the core, or city center, will become a desolate area lacking any form of new investment, ultimately immobilizing many of its residents from moving towards the outer periphery (Brown, 2009). According to sociologist David Halle (2003) many of the people left in the core region are of minority status, lower-income and in Los Angeles' case became immobilized due to the expansion of freeway construction disrupting their once vibrant community atmospheres.
Having never fully recovered from the dismantling of their communities due to freeway construction decades ago, Los Angeles' city center still expresses many of the characteristics described above. When looking at South Los Angeles, we can see that the core of the region is made up of residents of mostly minority, Latino status who also come from low-income families. The periphery of South Los Angeles, however, is comprised of a mix of residents, ranging in both income and race, but is skewed more towards smaller minority or Latino populations and higher income brackets. The people on the periphery have increased ability to move throughout the region due to their outer location and higher incomes when compared to those South Los Angeles residents living in the city's center. Knowing that the city's center is prone to lack new investments, it is no wonder no supermarkets are located directly near the center of South Los Angeles and instead are all located on the periphery. To locate in a disinvested area may increase the operating costs of a supermarket (increased security, increased lighting, etc), so it is not surprising from an economic stand point why supermarkets do not locate themselves in these central areas.
What is more interesting is how Burgess' concentric ring theory plays out not only throughout the city of Los Angeles as a whole, but actually plays out within the smaller city of Santa Monica as well. Looking at the above maps, the city of Santa Monica has an apparent core of low-income, mostly minority residents. Moving out from the center, the city's minority population begins to steadily decrease while median-household income begins to increase. As you reach the periphery parts of Santa Monica, minority or Latino populations are at an all time low, while median-household incomes are at an all time high. Similar to South Los Angeles, it is not surprising to see that supermarkets in Santa Monica have chosen to place themselves away from the city's slightly less invested core. I found the existance of the concentric ring theory in Santa Monica to be most interesting because it proved that no matter what size a city is or how fair they claim to be, de facto segregation may always exist at some scale.
Overall when comparing supermarket access between Santa Monica city residents and residents of South Los Angeles, I believe residents in Santa Monica have easier supermarket access for a number of reasons. The first reason is city size. When compared to all of South Los Angeles, the city of Santa Monica is relatively small, thus residents may have an easier time getting from one side of the city to another. Secondly, the city of Santa Monica has 11 grocery stores within its small radius of a single city while South Los Angeles has 9 major chain supermarkets across multiple cities. Even more interesting is the fact that only a small section of South Los Angeles was investigated, and it still had less major chain supermarkets when compared to the small city of Santa Monica on the Westside.
I can conclude from the results displayed above that communities with higher incomes and decreased concentrations of minorities not only have increased rates of community greenness and lower overall community temperatures, but that the wealthier, non-minority communities also have increased ease of access to more higher-end chain supermarkets than communities of lower incomes and higher minority concentrations.
Limitations
One of the main limitations in my study was time. Unable to visit all of my study sites first hand and actually talk to the people who live in the communities and shop at the grocery stores first hand, my study is based off of scholarly knowledge on areas, rather than on ethnographic research. I believe ethnographic research may have added more depth to the research at hand.
Another limitation to my study was that most of the data available was between seven to ten years old. If I were to perform this study again I would attempt to find more current data as many changes can occur in a city over a ten-year period.
One last limitation I encountered was my scope of the study ranges. Instead of comparing a single city (Santa Monica) to an entire region (South Los Angeles) my study should have looked at either a single city in South Los Angeles or instead looked at the entire West Los Angeles region in relation to South Los Angeles in order to level the playing field for more accurate analysis.
Future Research
If I had more time and appropriate funding I would love to add an ethnographic element to my research project. I would hope to not only interview shoppers from the different study regions and at the different supermarkets, but I would also take time to analyze supermarket customers as they shopped and take note of differences in price of common goods between supermarkets in the different locations. I would also like to expand my research to include how fast food and corner/convenience store establishments may play a role in the lives of residents within the different regions. If continuing this study, I would also like to contact the marketing and development departments of each of the major chain grocery stores in the area and attempt to talk with them about what factors are considered when attempting to build a new store in a community. Lastly, I believe it would also be very interesting to add in an analysis of how supermarket names and designs affect the psychology of customers and influence the type of consumer the supermarket attracts.
References
Brown, Nina. 2009. “Robert Park and Ernest Burgess: Urban Ecology Studies, 1925”. Regents of University of California. URL: http://www.csiss.org/classics/content/26.
Halle, David. 2003. “New York and Los Angeles”. University of Chicago Press.
Hendrickson, Deja, et al. 2006. “Fruit and vegetable access in four low- income food deserts communities in Minnesota”. Agriculture and Human Values. 23: 371-383.
Larson, Nicole I. 2009. “Neighborhood Environments: Disparities in Access to Healthy Foods in the U.S.”. American Journal of Preventive Medicine. 36(1): 74-81.
Morland, Kimberly B., et al. 2009. “Obesity prevalence and the local food environment”. Health and Place. 15(2): 491-495.
Park, Annie, et al. 2008. “South Los Angeles Healthy Equity Scorecard”. Community Health Councils, Inc (CHC). 1-101.
Pothukuchi, Kameshwari and Kaufman, Jerome L. 1999. “Placing the food system on the urban agenda: The role of municipal institutions in food systems planning”. Agriculture and Human Values. 16(2): 213-224.
Powell, Lisa M. et al. 2006. “Food store availability and neighborhood characteristics in the United States”. Preventive Medicine. 44: 189-195.
Reisig, and Hobbiss, . 2000. “Food deserts and how to tackle them: a study of one city's approach”. Health Education Journal. 59(2): 137-149.
U.S. Census. 2009. URL: http://www.census.gov/compendia/statab/
Yancey, Antronette K., et al. 2004. “Population-based interventions engaging communities of color in healthy eating and active living: a review”. Preventing Chronic Disease: Public Health Research, Practice and Policy. 1(1): 1-18.
